

Intro
This article is addressed for wider auditory of business analysts, data scientists, quality engineers and developers, in other words to people who work with data, make some analysis, build reports etc.
There are lot of real business cases that can be simply solved with Zentadata platform. Today we are going to take a closer look at the Data Studio application which is shipped together with Zentadata, it’s a simple user friendly desktop application that can be run locally on all popular platforms: MacOS, Windows, Linux.
Note: to install Zentadata Data Studio on your local machine please read our Quick start guide 🚀 article.
Data analytics use case - MovieLens Dataset
We are going to work with this dataset https://www.kaggle.com/datasets/grouplens/movielens-20m-dataset, so you can download it and follow all the steps from this article.
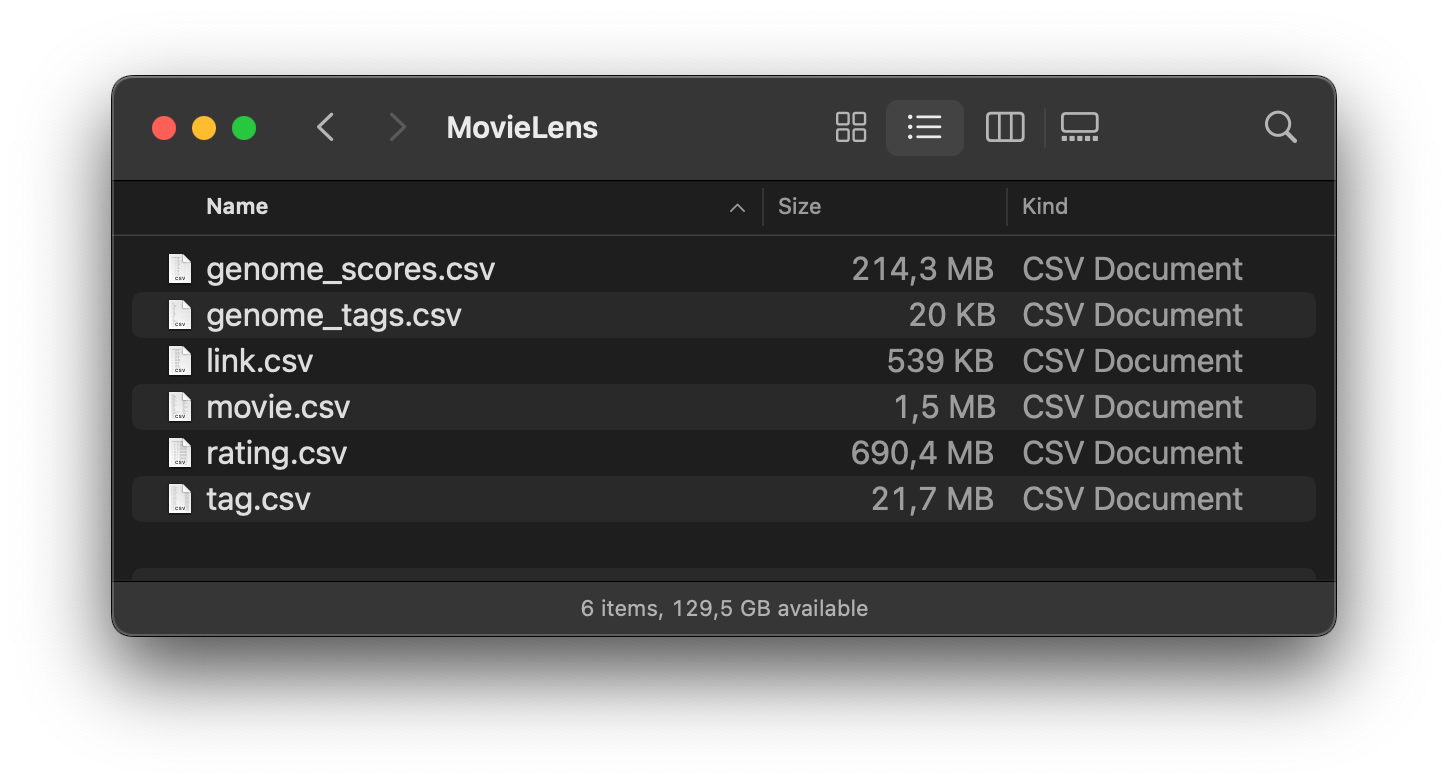
First of all let’s take a closer look at the mentioned dataset, it consists of a few big csv files, some of them contain more than 1m records so it even will not be possible to completely open them in MS Excel.
Also data is spread among a few files which have relation with each other.
Zentadata platform with Data Studio is a good set of tools which allows us to analyze those files very quickly without any kind of additional data preparation. You also can work with a bunch of different data formats, csv is only one of them. Even more, data can be spread across multiple files and folders or partitioned by datetime. It does not rally matter - for us it will be represented as a single DataFrame object (aka table in RDBMS terms).
Note: as for dataset size limitations:
- If you run
Zentadata Developer Editionyou can process up to hundreds GB of data, where performance depends on your machine hardware - And in case of
Zentadata Enterprisethere is no limit at all, being infinitely scalable it can process as much data as business needs
Alright let’s get started with a few test cases which will give you an understanding of platform flexibility and powerness.
Case #1 - join 2 csv files and calculate average movie rating
The dataset we have downloaded contains files movie.csv and rating.csv. They have a relationship by movieId field, where each rating was set by a specific user, and now we want to calculate the average rate for each movie from the list.
First of all, let's open the movie and rating files and verify the data. For that we will add 2 DataFrames and specify the source of the data.
String ROOT_PATH = "file:/Users/alex/Downloads";

DataFrame movies = zen
    .read("localfs")
    .format(DataFormat.CSV)
    .option(CsvOpts.HAS_HEADER, "true")
    .from(ROOT_PATH + "/MovieLens/movie.csv");

DataFrame ratings = zen
    .read("localfs")
    .format(DataFormat.CSV)
    .option(CsvOpts.HAS_HEADER, "true")
    .from(ROOT_PATH + "/MovieLens/rating.csv");
Now lets take first 5 records from each DataFrame and display them on screen:
movies.limit(5).execute().show();
ratings.limit(5).execute().show();

OUTPUT:
+-------+----------------------------------+-------------------------------------------+
|movieId|title                             |genres                                     |
+-------+----------------------------------+-------------------------------------------+
|1      |Toy Story (1995)                  |Adventure|Animation|Children|Comedy|Fantasy|
|2      |Jumanji (1995)                    |Adventure|Children|Fantasy                 |
|3      |Grumpier Old Men (1995)           |Comedy|Romance                             |
|4      |Waiting to Exhale (1995)          |Comedy|Drama|Romance                       |
|5      |Father of the Bride Part II (1995)|Comedy                                     |
+-------+----------------------------------+-------------------------------------------+
+------+-------+------+-------------------+
|userId|movieId|rating|timestamp          |
+------+-------+------+-------------------+
|1     |2      |3.5   |2005-04-02 23:53:47|
|1     |29     |3.5   |2005-04-02 23:31:16|
|1     |32     |3.5   |2005-04-02 23:33:39|
|1     |47     |3.5   |2005-04-02 23:32:07|
|1     |50     |3.5   |2005-04-02 23:29:40|
+------+-------+------+-------------------+
Writing queries using Zentadata query language is pretty straightforward and similar to writing standard SQL. Firstly we specify how data frames will be joined, then what we want to get out of that dataset and finally how to group the data.
movies
   .join(ratings, ratings.col("movieId").equalTo(movies.col("movieId")))
   .select(
           movies.col("movieId"),
           movies.col("title"),
           ratings.col("rating")
       )
   .groupBy(list(col("movieId"), col("title")), avg(col("rating")).as("average rating"))
   .limit(5)
   .execute().show();

OUTPUT:
+-------+------------------------------------------------------+------------------+
|movieId|title                                                 |average rating    |
+-------+------------------------------------------------------+------------------+
|4027   |O Brother, Where Art Thou? (2000)                     |3.891130068348836 |
|7153   |Lord of the Rings: The Return of the King, The (2003) |4.14238211356367  |
|2951   |Fistful of Dollars, A (Per un pugno di dollari) (1964)|3.9353664087391897|
|4995   |Beautiful Mind, A (2001)                              |3.91974830149104  |
|4015   |Dude, Where's My Car? (2000)                          |2.5065868263473052|
+-------+------------------------------------------------------+------------------+
So just a few lines and the task is completed. Please also note the listed query has a limit of 5 records to be displayed, you can either change or remove this filter if needed.
Case #2 - sorting and and where clause
Now we would like to find the most popular videos with a rating higher than 4.
Let’s create a new DataFrame and call it mostPopularMovies, then add 2 lines with where and sort clauses.
DataFrame mostPopularMovies = movies
   .join(ratings, ratings.col("movieId").equalTo(movies.col("movieId")))
   .select(
       movies.col("movieId"),
       movies.col("title"),
       ratings.col("rating")
   )
   .groupBy(list(col("movieId"), col("title")), avg(col("rating")).as("average rating"))
   .where(col("average rating").gt(lit("4")))
   .sort(col("average rating"));

mostPopularMovies.limit(5).execute().show();

OUTPUT:
+-------+----------------------------------------------------------------+-----------------+
|movieId|title                                                           |average rating   |
+-------+----------------------------------------------------------------+-----------------+
|91529  |Dark Knight Rises, The (2012)                                   |4.00020964360587 |
|76093  |How to Train Your Dragon (2010)                                 |4.000420079815165|
|1952   |Midnight Cowboy (1969)                                          |4.000634719136782|
|7096   |Rivers and Tides (2001)                                         |4.001824817518248|
|4928   |That Obscure Object of Desire (Cet obscur objet du désir) (1977)|4.003125         |
+-------+----------------------------------------------------------------+-----------------+
And that’s simply it.
Case #3 - filtering by tags
Next step will be selecting movies by tags, those tags have been assigned by users for each movie and they are stored in a separate file. For that first of all we look into the tag.csv file and investigate its structure.
DataFrame tags = zen
    .read("localfs")
    .format(DataFormat.CSV)
    .option(CsvOpts.HAS_HEADER, "true")
    .from(ROOT_PATH + "/MovieLens/tag.csv");

tags.limit(5).execute().show();

OUTPUT:
+------+-------+-------------+-------------------+
|userId|movieId|tag          |timestamp          |
+------+-------+-------------+-------------------+
|18    |4141   |Mark Waters  |2009-04-24 18:19:40|
|65    |208    |dark hero    |2013-05-10 01:41:18|
|65    |353    |dark hero    |2013-05-10 01:41:19|
|65    |521    |noir thriller|2013-05-10 01:39:43|
|65    |592    |dark hero    |2013-05-10 01:41:18|
+------+-------+-------------+-------------------+
It also has a reference to movies by id, and contains a bunch of tags placed by users, so let’s join it with the most popular movies and try to find movies that contain the tag Comedy.
mostPopularMovies
.join(tags, tags.col("movieId").equalTo(mostPopularMovies.col("movieId")))
.select(
   mostPopularMovies.col("movieId"),
   mostPopularMovies.col("title"),
   mostPopularMovies.col("average rating"),
   tags.col("tag")
 )
.where(col("tag").contains(lit("Comedy")))
.limit(5)
.execute().show();

OUTPUT:
+-------+--------------------------------------+------------------+----------------+
|movieId|title                                 |average rating    |tag             |
+-------+--------------------------------------+------------------+----------------+
|356    |Forrest Gump (1994)                   |4.029000181345584 |Classic Comedy  |
|356    |Forrest Gump (1994)                   |4.029000181345584 |Comedy          |
|1136   |Monty Python and the Holy Grail (1975)|4.174146075581396 |Classic Comedy  |
|910    |Some Like It Hot (1959)               |4.082677165354331 |Comedy          |
|951    |His Girl Friday (1940)                |4.1529984623270115|Screwball Comedy|
+-------+--------------------------------------+------------------+----------------+
Case #4 - join csv files with database table
Let’s do something more exciting now. We will create a report which will filter movies by user details that are going to be taken from a relational database.
You probably noticed that the provided dataset does not contain a user file but movies and rates have userId fields. We can assume that we have users table in our relational database and it needs to be joined with data from csv files in order to filter by user's data. Well it’s a piece of cake for Zentadata.
For the demonstration purposes I have created a simple table in Postgres and added a couple of records.
CREATE TABLE users
(
    id INTEGER PRIMARY KEY,
    first_name VARCHAR,
    last_name VARCHAR,
    country  VARCHAR
);

INSERT INTO users (id, first_name, last_name, country)
VALUES (1, 'John', 'Dow', 'US'),
       (2, 'Nuria', 'Fabricio', 'US'),
       (3, 'Itzel', 'Langosh', 'US'),
       (4, 'Lilliana', 'Larkin', 'PL'),
       (5, 'Walker', 'Quigley', 'PL');
Now let’s join that Postgres table with csv files and create a report which will filter out users outside of US.
DataFrame users = zen.read("postgres").from("users");
users.execute().show();
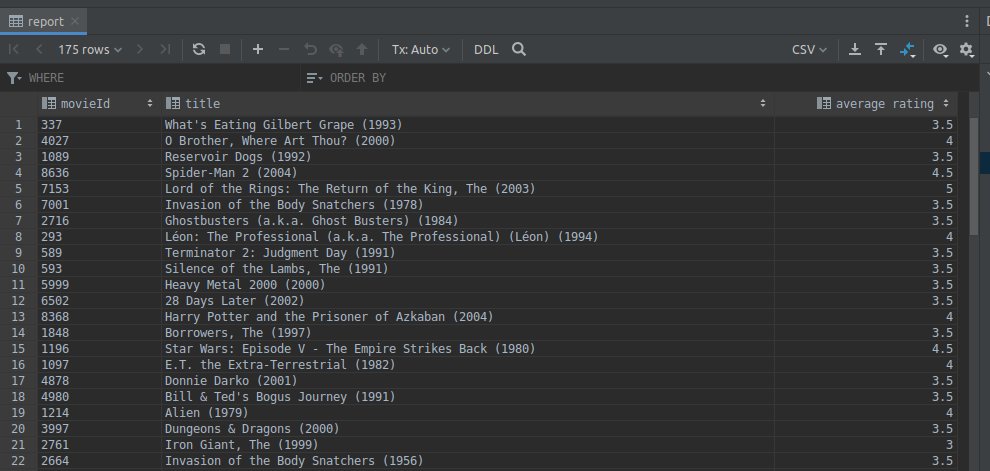
DataFrame report = movies
.join(ratings, ratings.col("movieId").equalTo(movies.col("movieId")))
.join(users, ratings.col("userId").equalTo(users.col("id")))
.select(
movies.col("movieId"),
movies.col("title"),
ratings.col("rating"),
users.col("id")
)
.where(col("country").equalTo(lit("US")))
.groupBy(list(col("movieId"), col("title")), avg(col("rating")).as("average rating"));
report.limit(5).execute().show();
OUTPUT:
+--+----------+---------+-------+
|id|first_name|last_name|country|
+--+----------+---------+-------+
|1 |John |Dow |US |
|2 |Nuria |Fabricio |US |
|3 |Itzel |Langosh |US |
|4 |Lilliana |Larkin |PL |
|5 |Walker |Quigley |PL |
+--+----------+---------+-------+
+-------+------------------------------------------------------+--------------+
|movieId|title |average rating|
+-------+------------------------------------------------------+--------------+
|4027 |O Brother, Where Art Thou? (2000) |4.0 |
|7153 |Lord of the Rings: The Return of the King, The (2003) |5.0 |
|2951 |Fistful of Dollars, A (Per un pugno di dollari) (1964)|4.0 |
|337 |Whats Eating Gilbert Grape (1993) |3.25 |
|2797 |Big (1988) |4.0 |
+-------+------------------------------------------------------+--------------+
As you can see from our perspective there is no difference in the source of data, for us it's a DataFrame that can be operated in the same manner.
Case #5 - saving report to the relational database
Now our boss wants the report to be a separate table in the database. Sounds like a huge amount of work, but with help of Zentadata platform you can do it just in a few minutes and what is more important just in couple of lines of code.
report.write("postgres")
   .option(SaveMode.KEY, SaveMode.OVERWRITE)
   .to("report");
And that’s it, let’s check out Postgress, so you will see a new table report has been created. It has a similar structure as our select statement, and it also contains all the data.
Summary
We went through a few cases that might give you an understanding of a product and bring ideas how you can use it in your daily work. Zentadata platform and tools shipped with it like Data Studio can significantly improve your productivity and make life easier.
In the next article we will discuss how to work with big data from java spring boot applications.